

PawBoost 2026 Annual Report
This report is published by PawBoost, based on data from the lost and found pet reports processed on its platform between August 1, 2025 and July 31, 2026. PawBoost is a pet reunification platform used by millions of pet owners, finders, and shelters across the U.S. and internationally.
Each year, PawBoost intakes hundreds of thousands of lost and found pet reports directly from pet owners and finders, making it the largest public database of lost and found pets in the world.
Definitions for the terms and metrics used throughout this report, including how we count a “report,” a “reunion,” and the difference between “lost” and “found” reports, are provided in the Methodology & Definitions section.
Key Takeaways
- PawBoost processed 644,798 lost and found pet reports between August 1, 2025 and July 31, 2026. 264,508 resulted in a confirmed reunion, an overall reunited rate of 41.2%.
- Lost pets reunite at a much higher rate than found pets (49.0% vs. 27.1%), and the gap holds across species.
- Fireworks produce the biggest spikes in lost dog reports. Dog reports jumped 230% the day after July 4th in the U.S., while cat reports were essentially flat.
- Cats show a much bigger summer-vs-winter seasonal swing than dogs (+19.6% vs. +1.3%), and that swing is sharpest in cold weather regions like the Northeast.
- Nearly half of all reunions happen within 24 hours of being reported, and more than three-quarters happen within the first week.
- Nearly 3 in 10 users said PawBoost played a role in reuniting the pet. During the year, PawBoost also generated nearly 1.3 billion Facebook impressions, sent more than 304 million email alerts, and recorded 36.7 million Lost & Found database impressions.
The Year at a Glance
PawBoost took in 644,798 lost & found pet reports from the public during the reporting period, August 1, 2025 through July 31, 2026.
264,508 pets were reunited with their families, an overall reunited rate* across all species of 41.2%.
| Category | Total |
|---|---|
| Lost Pets | 413,592 |
| Found Pets | 231,206 |
A breakdown of reunited rates by status and species can be found in “How Pets Get Home” below.
*Reunited rate. Share of lost and found pet reports, across all species, that resulted in a confirmed reunion. Of the 644,798 total reports, 2,810 are excluded from this calculation because the outcome is unknown or not a live reunion – pets found deceased, and reports from removed or deleted accounts with no confirmed reunion – leaving a base of 641,988. Reports marked rehomed, surrendered, or deceased are always counted as not reunited. Reports were filed between August 1, 2025 and July 31, 2026; reunions recorded through October 1, 2026 are included.
The State of Lost & Found Pets
Between August 1, 2025 and July 31, 2026, lost and found pet reports followed clear, consistent patterns tied to holidays, the season, and the day of the week.
What’s being reported
Dogs and cats make up 97.9% of all lost and found pet reports: dogs 56.8%, cats 41.2%. The rest includes birds (1.3%), reptiles, rabbits, and “other” (0.2% each), as well as a small number of ferrets and horses.
Holiday spikes
Holiday figures in this section cover U.S. reports only, using each report’s local date. The biggest spike in lost pet reports during the reporting period occurred around July 4th. Reports peaked on July 5th, up 138% over baseline*, as pets that went missing over the holiday were reported the next day. July 4th itself saw a smaller, still meaningful increase of 62%. The same pattern appears around New Year’s: reports rose 88% on January 1st.
Labor Day (+12%) and Memorial Day (+9%) saw more modest increases, spread fairly evenly across species. Halloween (-13%) and Thanksgiving (-11%) actually saw fewer reports than a typical day. Christmas saw a small increase overall (+9%), with dog reports up 22% and cat reports down 12%.
The impact of fireworks: dogs vs. cats
Holidays with fireworks produced the sharpest difference between dogs and cats in the entire dataset. On July 5th, dog reports were up 230% over baseline while cat reports were essentially flat (+6%). The same pattern held around New Year’s Day (dogs +139%, cats +3%). Noise sensitivity to fireworks and other loud sounds is well documented in dogs, and the data reflects it: Cats don’t show the same large increase as dogs on these dates.
If you have a dog: July 4th and New Year’s are the two highest-risk days of the year for a dog to go missing, driven by noise sensitivity to fireworks. Keep dogs in a secure, quiet indoor space during fireworks and celebrations, and make sure their ID tag and microchip registration are current beforehand. More tips on July 4th preparedness can be found here.
Summer vs. winter
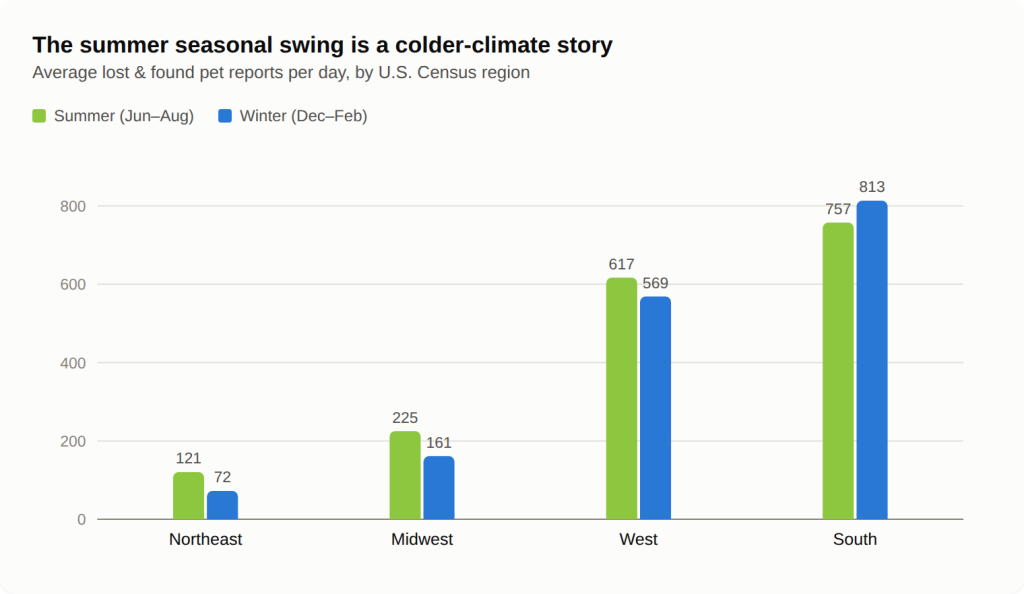
Report volume is generally higher in the summer than the winter, but the size of that swing varies by region. Across all countries, reports averaged 1,865 per day across the summer months (August, June, July) compared to 1,702 per day across the winter months (December–February), a 9.6% increase. The differences are more telling when broken out by U.S. Census region (U.S. reports only):
| Region | Summer avg/day | Winter avg/day | Difference |
|---|---|---|---|
| Northeast | 120.5 | 72.2 | +66.8% |
| Midwest | 225.0 | 161.3 | +39.5% |
| West | 616.6 | 568.5 | +8.5% |
| South | 757.3 | 813.2 | -6.9% |
The Northeast saw reports increase 67% in the summer relative to winter, while the South actually saw a small decrease (-7%). The summer increase that shows up overall is therefore largely a colder-climate phenomenon. The dog, cat, and bird figures that follow also cover all countries.
Dog vs. cat differences
Outside of fireworks-driven spikes, the seasonal increase is driven almost entirely by cats. Cat reports averaged 774 per day in the summer versus 647 per day in the winter, a 19.6% increase. Dog reports stayed relatively flat across seasons: 1,044 per day in the summer versus 1,030 per day in the winter, a difference of just 1.3%.
Birds
Birds show a sharper seasonal swing than cats or dogs. Bird reports averaged 30.7 per day in the summer versus 14.3 per day in the winter. This represents a 114.7% increase, more than double the winter rate.
Day-of-week trends
Reports also followed a weekly pattern. Monday was the highest-volume day, averaging 1,864 reports, and Friday the lowest, averaging 1,686 – a difference of 10.6%. Sunday was nearly as high as Monday, averaging 1,861 reports.
*Baseline. Unless noted otherwise, “baseline” is the average number of daily reports across the three weeks before and three weeks after a given date, excluding that date itself.
How Pets Get Home
264,508 pets were reunited, an overall reunited rate* across all species of 41.2%.
Reunited rate breakdown
| Category | Reunited Rate |
|---|---|
| Lost (all species) | 49.0% |
| Found (all species) | 27.1% |
| Lost Dogs | 52.5% |
| Found Dogs | 31.6% |
| Lost Cats | 46.3% |
| Found Cats | 16.3% |
Lost pets are reunited at a significantly higher rate than found pets, and the gap holds for both dogs and cats individually. Dogs reunite at a higher rate than cats overall (43.2% vs. 39.1%). Reunited rates are substantially lower for birds at 19.8%, less than half the rate for dogs.
Part of the gap between Found Dogs (31.6%) and Found Cats (16.3%) is explained by the type of report submitted. Found reports can indicate that the finder has physically secured the pet or has only spotted it without catching it (a “sighting”)†. For dogs, a sighting report reunites at roughly 40% the rate of a secured report (14.1% vs. 34.7%). For cats, the gap between the two is narrower: A sighting reunites at 12.9% versus 19.8% secured, about 65% as often. Cats are reported as sightings far more often than dogs (29.4% of found cat reports vs. 12.3% of found dog reports), which pulls the overall reunited rate for found cats down.
However, the higher share of sighting reports among cats explains only part of the species gap. If found cat reports had the same secured/sighting mix as dogs, their reunited rate would rise from 16.3% to roughly 19.0%, still well below the 31.6% rate for found dogs. The main reason for the species gap is the difference in reunited rates among found pets that have been secured (secured cats vs. secured dogs: 19.8% vs. 34.7%). Interestingly, that species gap nearly disappears for sighting-only reports (12.9% vs. 14.1%): Sighted dogs and cats are reunited at close to the same rate.
†”In my possession” and “Sighting (still roaming)” are sub-classifications of Found reports, captured separately from initial and final status. An “In my possession” report means the finder has the pet secured in their possession; a “Sighting (still roaming)” report means the finder has spotted but not caught the pet. A small remaining share of Found reports either carry no such sub-classification or are classified as “Found deceased”; the latter are excluded from reunited-rate calculations.
Reunited rate by geography
Reunited rates vary substantially by state. There is a roughly 21-point difference between the highest and lowest states with meaningful sample size.
| Top 10 States | Rate | Bottom 10 States | Rate |
|---|---|---|---|
| Colorado | 52.5% | Indiana | 39.0% |
| Wisconsin | 51.0% | Kentucky | 39.0% |
| Virginia | 49.9% | California | 38.8% |
| North Dakota | 48.8% | Oklahoma | 38.8% |
| Idaho | 48.7% | Texas | 37.5% |
| New Jersey | 48.0% | Georgia | 36.9% |
| Delaware | 47.8% | Louisiana | 36.1% |
| Utah | 47.8% | Arkansas | 36.0% |
| Iowa | 47.7% | Alabama | 34.8% |
| New Hampshire | 47.5% | Mississippi | 31.8% |
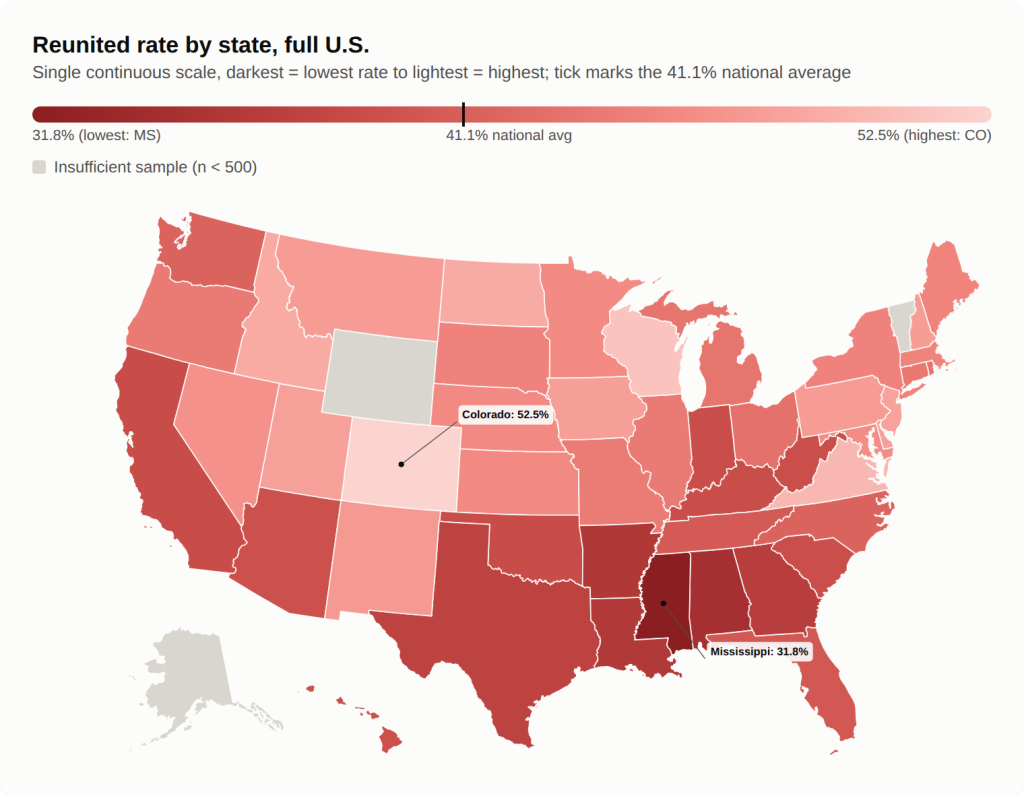
Reunited rates differ not just by state but by region. The Northeast has the highest reunited rate at 46.3%, followed by the Midwest at 44.1%, while the South has the lowest rate at 39.3%.
International
Reunited rates also vary substantially by country:
| Country | Reunited Rate |
|---|---|
| United Kingdom | 49.1% |
| Australia | 46.8% |
| Canada | 46.1% |
| United States | 41.1% |
| South Africa | 39.6% |
| Brazil | 20.0% |
| Mexico | 16.9% |
At 49.1%, the UK has the highest reunited rate among the countries compared (19.5% higher than the U.S. rate). Australia and Canada also reunite pets at a notably higher rate than the U.S. South Africa lands just below the U.S., while Brazil and Mexico sit well below all of them. PawBoost’s site and alerts are currently English-first, which could play a role in the lower rates in non-English-speaking countries, though this data can’t tell us why those differences exist.
Time-to-reunited
Among pets that were reunited, the typical case moved fast: the median time to reunion was 1.48 days. The average was much higher at 6.43 days, pulled up by a relatively small number of long-running cases. Dogs reunite roughly twice as fast as cats: a median of 0.99 days versus 2.04 days.
| Category | Median | Average |
|---|---|---|
| Lost (all species) | 1.78 days | 6.93 days |
| Found (all species) | 0.91 days | 4.79 days |
| Lost Dogs | 1.16 days | 5.58 days |
| Found Dogs | 0.73 days | 3.94 days |
| Lost Cats | 2.03 days | 8.44 days |
| Found Cats | 2.10 days | 8.99 days |
Found dogs reunite faster than lost dogs, but the same pattern doesn’t hold for cats. Found dogs reunite 37% faster than lost dogs (0.73 vs. 1.16 days median). Found cats show very little difference from lost cats (2.10 vs. 2.03 days median).
Likelihood of reunion by time missing
| Time Since Report | Share of All Reunions |
|---|---|
| Within 24 hours | 43.9% |
| Within 3 days | 68.9% |
| Within 1 week | 77.3% |
| Within 2 weeks | 87.1% |
| Within 1 month | 96.0% |
| Within 3 months | 99.2% |
| Within 6 months | 99.8% |
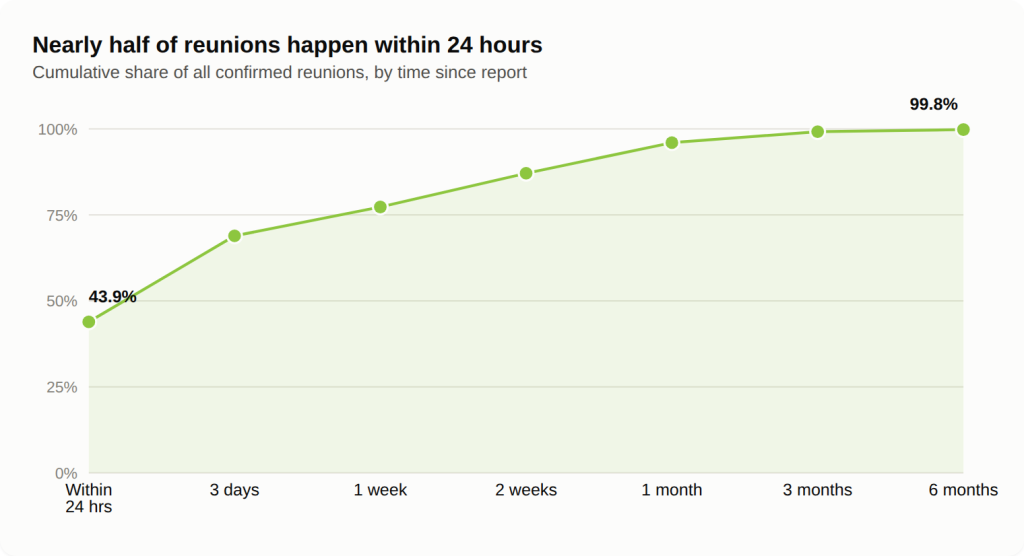
The first 24 hours matter most: Nearly half of confirmed reunions happen within 24 hours of the report being filed, and more than three-quarters happen within the first week. Reunions do still happen well past that point, though: 0.8% of all confirmed reunions occurred more than three months after the pet was first reported.
*Reunited rate. Share of lost and found pet reports, across all species, that resulted in a confirmed reunion. Of the 644,798 total reports, 2,810 are excluded from this calculation because the outcome is unknown or not a live reunion – pets found deceased, and reports from removed or deleted accounts with no confirmed reunion – leaving a base of 641,988. Reports marked rehomed, surrendered, or deceased are always counted as not reunited. Reports were filed between August 1, 2025 and July 31, 2026; reunions recorded through October 1, 2026 are included.
PawBoost’s Role in the Ecosystem
PawBoost’s role in a reunion is to get a lost or found pet in front of the people most likely to help: neighbors, shelters, pet owners, and finders. Not every reunion is facilitated by PawBoost. The numbers below reflect the reach and activity generated directly through PawBoost.
Reach
During the reporting period (August 1, 2025 – July 31, 2026), PawBoost generated the following reach across its channels. This does not capture every channel PawBoost operates in. The platform also reaches a significant audience through its partnership with Nextdoor‡, but reliable figures for that channel weren’t available for this reporting period.
| Metric | Total |
|---|---|
| Email Alerts Sent | 304,820,875 |
| Facebook Impressions | 1,292,938,277 |
| Facebook Comments | 3,068,110 |
| Lost & Found Database (LFDB) Impressions | 36,657,077 |
| Direct Messages Sent (to pet owners/finders) | 258,214 |
| Direct Messages Sent (to shelters) | 7,823 |
| Mobile App Installs | 110,282 |
Email Alerts Sent counts every alert email sent to a user about a lost, found, or reunited pet near them.
Facebook Impressions and Comments reflect activity across PawBoost’s network of local Facebook Pages, where lost and found pet alerts are shared directly into local communities.
LFDB Impressions counts page views of the lost & found pet feed (one per page view, not per pet shown) plus individual pet listing page views on pawboost.com.
Direct Messages counts messages sent through PawBoost connecting pet owners/finders to each other, and connecting them to partner shelters.
Mobile App Installs counts new installs of PawBoost’s app during the reporting period (74,144 iOS / 36,138 Android); it does not capture in-app engagement or usage beyond the initial install.
‡ KRCR News, May 2022 (archived)
These numbers span different kinds of reach. For example, a Facebook impression is not the same unit as a database page view or an email notification, so we report them separately rather than combining them into a single “total reach” figure.
Global Reach
While PawBoost’s core user base resides in the United States, it is used internationally as well. Of the 644,798 lost & found pet reports filed during the reporting period, 93.6% originated in the United States and 6.4% came from outside it, most commonly Canada, the United Kingdom, Australia, and Brazil.
Shelter Partnerships
PawBoost added 60 new shelter partners during the reporting period. Each partner’s stray intakes get added to PawBoost’s lost & found database, and a daily post featuring a sample of recent stray intakes gets shared to the local Facebook Page for their area. The partnership puts shelter animals in front of PawBoost’s existing audience rather than requiring the shelter to build one of its own. The largest shelter added by annual intake volume was San Antonio Animal Care Services.
Reunions Attributed to PawBoost
When users report that a pet has been reunited, PawBoost asks pet owners and finders a simple follow-up question: Did PawBoost directly help reunite the pet? Among users who answered, 29.4% said yes.†
Given how many ways a lost pet can make it home – finding its own way back, a tag or microchip scan, or word of mouth from a neighbor – nearly 3 in 10 respondents directly attributing their reunion to PawBoost suggests the platform plays a meaningful role in many reunions.
†Of pet owners and finders surveyed after a confirmed reunion, 63.3% answered the question (42,671 “Yes,” 102,661 “No”); users who did not answer are excluded from this rate.
Methodology & Definitions
This section contains the definitions and methodology used throughout this report, both for readers who want the full picture and for anyone looking to verify how a specific figure was calculated.
Data Source & Scope
All pet-level statistics in this report (Sections 1–3) are drawn from PawBoost’s internal lost & found pet report database. A report is included in this dataset only if it was submitted with a photo. Reports without a photo are typically incomplete or abandoned submissions and were excluded from the analysis. Within the reporting period, this yielded 644,798 qualifying reports.
Reach metrics in Section 4 (email alerts, impressions, comments, messages, app installs, shelter partnerships, and the attributed-reunion survey) are drawn separately from PawBoost’s platform and marketing analytics, not from the pet report database itself.
Reporting Period
This report covers August 1, 2025 through July 31, 2026. This window refers to when reports were filed. Reunion outcomes for those reports are tracked through October 1, 2026, so a small share of the reunions counted here (about 1.6%) occurred after July 31, 2026.
Report Types: Lost vs. Found
“Lost” and “Found” refer to who filed the report, not the outcome. A “Lost” report is filed by an owner reporting their own pet missing. A “Found” report is filed by someone who found a pet belonging to someone else. Neither term implies the pet was reunited; that outcome is tracked separately and described below.
Reunited Rate Methodology
A pet is counted as reunited if it has a recorded reunited timestamp and its final status is not “rehomed,” “surrendered,” or “deceased.” A small number of reports are marked as removed by the user or associated with a deleted account; these are counted as reunited only if a reunited timestamp was recorded, and are otherwise excluded entirely from both the reunited and not-reunited counts, since their outcome is genuinely unknown rather than a non-reunion. This rule is applied consistently to every reunited-rate figure in this report, including the overall rate, species-level rates, and geographic breakdowns.
Found reports sub-classified as “deceased” are also excluded entirely from reunited-rate calculations. Regardless of what their top-level status shows, this outcome doesn’t reflect a live reunion.
Median, rather than mean, is used as the primary measure of time-to-reunited throughout this report, because a small number of long-duration cases pull the average upward in a way that isn’t representative of a typical reunion. Mean figures are noted alongside the median for context where relevant.
Time-to-reunited is measured from a report’s creation timestamp to its reunited timestamp, rather than from the pet’s last-seen date; last-seen date is recorded only to the day rather than the exact time, which adds meaningful imprecision at this scale.
Time Zone Note
All timestamps in the underlying dataset are recorded in UTC. Seasonal and day-of-week findings, which cover all countries, use UTC dates. Holiday comparisons cover U.S. reports only and convert each timestamp to the local date for the report’s state, using the state’s primary time zone (approximate for states spanning two time zones; Eastern for the small number of U.S. reports with no state recorded). Because local time cannot be reliably reconstructed for every report, this report does not include time-of-day findings.
Seasonal & Holiday Comparisons
Where this report compares report volume on a specific date (such as a holiday) to typical volume, “typical” or “baseline” volume is calculated as the average daily report count across the three weeks before and three weeks after that date, excluding the date itself. Holiday comparisons use U.S. reports only; seasonal and day-of-week comparisons use reports from all countries.
Geographic Classification
State and country figures reflect the location self-reported by the person filing the lost or found pet report. Regional groupings (Northeast, Midwest, South, West) follow the U.S. Census Bureau’s official four-region classification.
Attributed-to-PawBoost Reunion Survey
After a pet is reported as reunited, PawBoost asks pet owners and finders a single yes/no question: Did PawBoost directly help reunite the pet? The reported rate (29.4%) is calculated only among users who answered the question (63.3% response rate); users who did not answer are excluded from the calculation rather than counted as “No.”
Reach Metric Definitions
Email Alerts Sent: an alert email sent to a user about a lost, found, or reunited pet near them.
Facebook Impressions and Comments: activity across PawBoost’s network of local Facebook Pages, where lost and found pet alerts are shared directly into local communities.
Lost & Found Database (LFDB) Impressions: page views of the lost & found pet feed (one per page view, not per pet shown) plus individual pet listing page views on pawboost.com.
Direct Messages Sent: messages sent through PawBoost connecting pet owners/finders to each other, and connecting them to partner shelters.
Mobile App Installs: new installs of PawBoost’s mobile app during the reporting period, combining iOS and Android; this does not capture in-app engagement or usage beyond the initial install.
This report includes new app installs but not broader in-app engagement or push notifications sent, and does not include reach figures for Nextdoor; reliable figures for these were not available for this reporting period.
Press & Data Inquiries
For interview requests, additional data, or questions about this report’s methodology, contact clayton@pawboost.com.